

 Tiếng Việt
 日本語
A Salesforce dynamic dashboard is a dashboard that runs as the person viewing it: the whole team shares one dashboard, but each person who opens it sees data according to their own data access. If you have 10 reps and 10 identical dashboards that differ only by name, you do not need to.
The short answer: set the dashboard to run as the logged-in user, add filters by region or product so managers can switch quickly, and data visibility still follows your data permissions. One caution: the number of dashboards of this type is limited by edition, so check before you build.
Important note: the office equipment distributor with 10 sales reps below is a hypothetical example, not a real customer. Features and limits depend on edition and license, and menu names may differ by release. The steps are based on documentation and should be tested in your own environment before rolling out to the team.
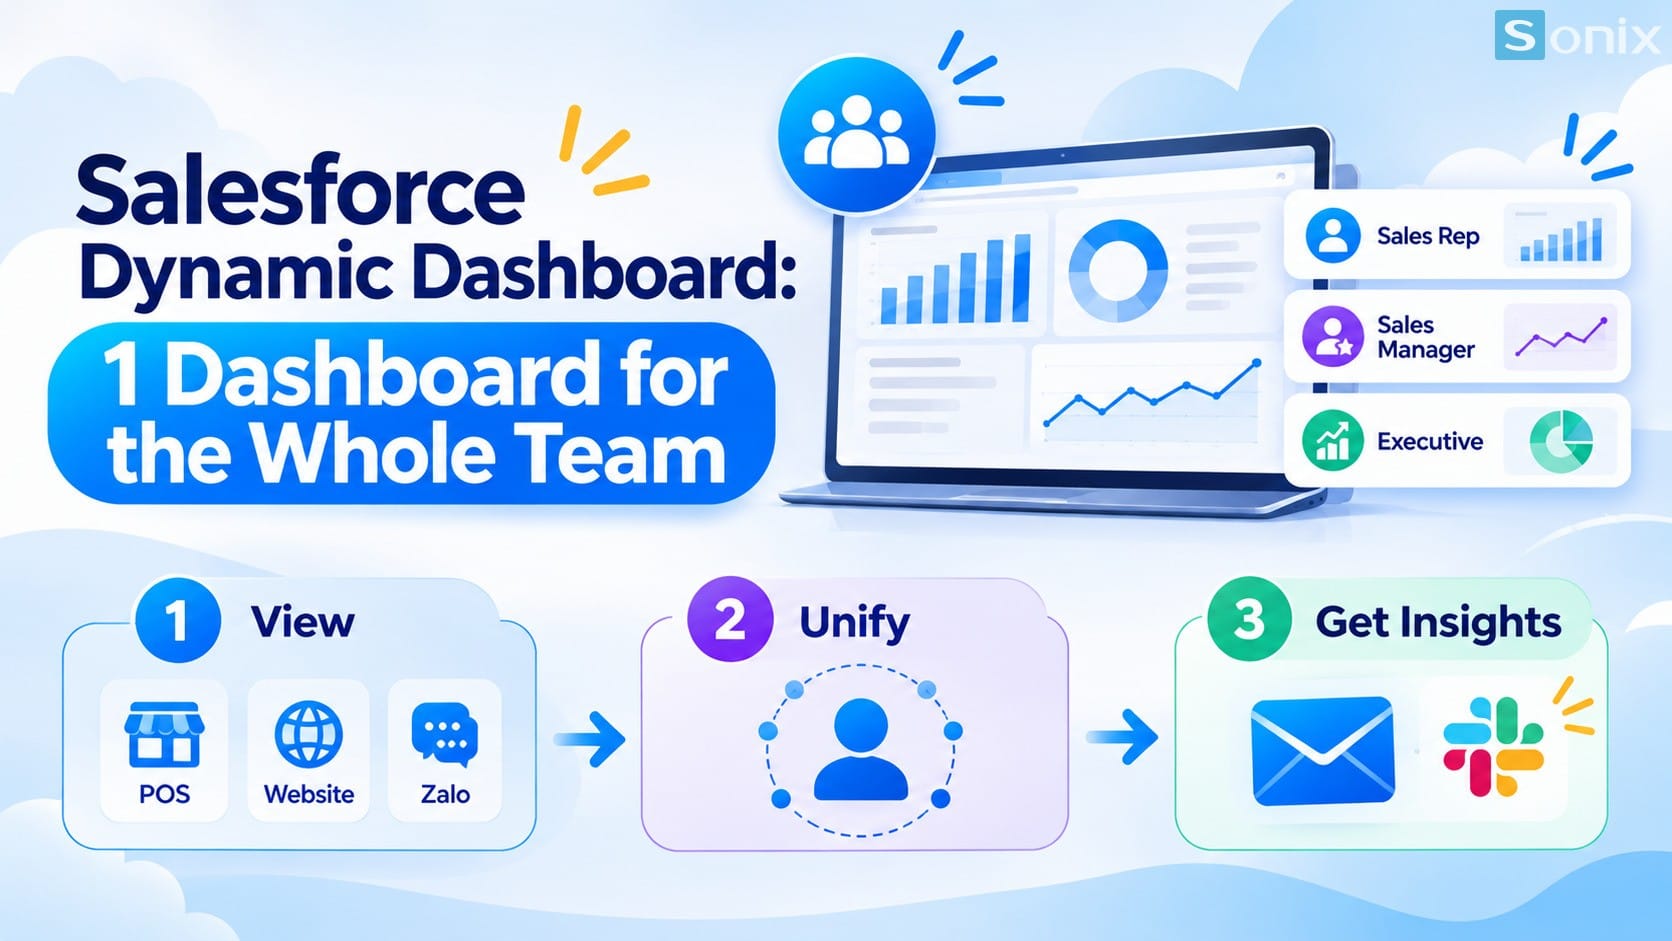 The same dashboard, and each rep who opens it sees data according to their own access.
Why 10 identical dashboards are a problem
The familiar approach is to build one dashboard and clone it for each rep, each copy running as a different person. That is fine for a small team. But when a manager wants to add a chart or change a filter, they must edit each copy in turn. Ten reps means ten edits, and missing one means everyone’s numbers drift apart.
| One dashboard per person | One dashboard that runs as the viewer | |
|---|---|---|
| Dashboards to manage | As many as reps | One |
| When one thing changes | Edit each copy in turn | Edit once, the whole team sees it |
| New rep joins | Clone another copy | Just share the folder |
| Risk | Copies drift apart over time | One definition for the whole team |
What is a Salesforce dynamic dashboard
According to the official Salesforce documentation, in View Dashboard As you choose whose identity the dashboard runs as. With The dashboard viewer, readers see data according to their own access. This type of dashboard is often called a dynamic dashboard.
There is one easy misunderstanding to clear up early: a dashboard that runs as the viewer does not automatically filter down to each person’s own numbers. It only shows what the viewer is allowed to see under data permissions. To make each rep see only their own numbers, use a source report with a suitable scope, such as the Show Me filter set to My Opportunities, and let managers see team numbers under their own access.
How to set up a Salesforce dynamic dashboard: 3 steps
The three steps below follow the demo order. Menu names may differ by release.
Set the dashboard to run as the viewer
- Open the dashboard, choose Edit, and open the Properties menu (the gear icon)
- Under View Dashboard As, choose The dashboard viewer and save. Everyone who opens it sees data according to their own access
- The optional Let dashboard viewers choose whom they view the dashboard as lets people with suitable permissions view as someone else, for example a manager viewing as a direct report
Add filters so managers can switch quickly
- In the dashboard editor, add filters on fields such as region or product
- Filters appear at the top of the dashboard, and viewers pick values to change the view without opening each report
- Check which components are affected, because reports without that field will not be filtered
Check data permissions
- Log in as a few real accounts (a rep, a manager) to see what each person sees
- Cross-check with your sharing and role hierarchy setup. A dashboard never widens anyone’s data access
For another step-by-step walkthrough, see Perficient’s guide. If your CRM foundation is not solid yet, read our Salesforce Sales Cloud setup guide in 10 minutes first.
Limits to know before you build
This is the most important part to read before committing to this approach.
The number is limited by edition. According to Salesforce documentation as quoted by many sources, an org can have up to 5 dynamic dashboards in Enterprise, 10 in Unlimited and Performance, and 3 in Developer, and more may be available for purchase. Figures can change, so check the official documentation for your edition instead of relying on this article.
Cannot be saved in private folders. These dashboards need to live in a shared folder.
No scheduled refresh. According to the documentation, dynamic dashboards must be refreshed manually. Tell the team they need to hit refresh to see new numbers.
Some components are not supported. Check the list of unsupported components in the documentation before you design.
Email subscriptions may be limited. Some sources say you cannot subscribe to dashboards that display data as the viewer. If you need to send numbers on a schedule, consider scheduled reports.
Because the number is limited, save these slots for your most important shared dashboards, such as the sales team’s pipeline, and use other approaches for the rest.
Example: 10 reps, 1 dashboard
Hypothetical example: an office equipment distributor has 10 sales reps and 1 manager. They used to maintain 10 identical pipeline dashboards. After switching to one dashboard that runs as the viewer, with a source report scoped to My Opportunities, the whole team shares one copy.
| Who opens the dashboard | What they see | How it works |
|---|---|---|
| Sales rep | Their own pipeline and deals | Source report scoped to My Opportunities, access per sharing |
| Sales manager | The whole team’s numbers, or view as each rep | Access per role hierarchy, with the view-as option turned on |
| Manager switching views | Filtered by region or product | Dashboard filters at the top of the page |
The expected result is one dashboard instead of ten, and one place to edit when something changes. The article gives no specific figures because this is a hypothetical example.
If you are weighing a stronger analytics tool than built-in reports, read What Is Tableau and how it differs from Reports & Dashboards. Related solutions are on the Sonix Salesforce page (in Vietnamese).
Checklist before switching to a Salesforce dynamic dashboard
Before merging near-identical dashboards, run through this short list.
☐ Counted how many near-identical dashboards you maintain
☐ Checked the dynamic dashboard limit for your edition
☐ Chosen which dashboards deserve this mode
☐ Used source reports with a suitable scope, such as My Opportunities
☐ Added region and product filters and checked which components are affected
☐ Logged in as a rep and a manager to test permissions
☐ Told the team about manual refresh
How many near-identical dashboards are you maintaining? Leave the number in the comments and the Sonix team will suggest how to merge them.
Salesforce CRM
Guide
Data Analytics
Business Intelligence
Book a consultation with Sonix to review your current dashboards and merge them neatly, in line with your edition and permissions.
Sonix: Your success is our happiness.
Leave us your comment