

 Tiếng Việt
 日本語
Tableau Salesforce is a way to combine deal data in Salesforce with invoice and receivables data from your accounting system, so you can see one picture from the moment a deal closes to the moment cash arrives. Picture the weekly meeting: sales say they hit 120% this month, accounting says only 70% of the money is in. Both are right, because the two sides are looking at different numbers.
The short answer: Tableau can connect to several sources at once, so one dashboard can show deals closed, invoiced, collected and overdue. One requirement is non-negotiable: the two systems need a shared key, such as a customer code or contract number.
Important note: the office equipment distributor and the 120% and 70% figures below are hypothetical examples, not real customers. How to pull data from accounting software depends on the system you use and needs specific investigation. Tableau has its own license, features depend on plan, and menu names may differ by release. Definitions of revenue and receivables need your chief accountant’s confirmation. Content is general reference, not financial or accounting advice.
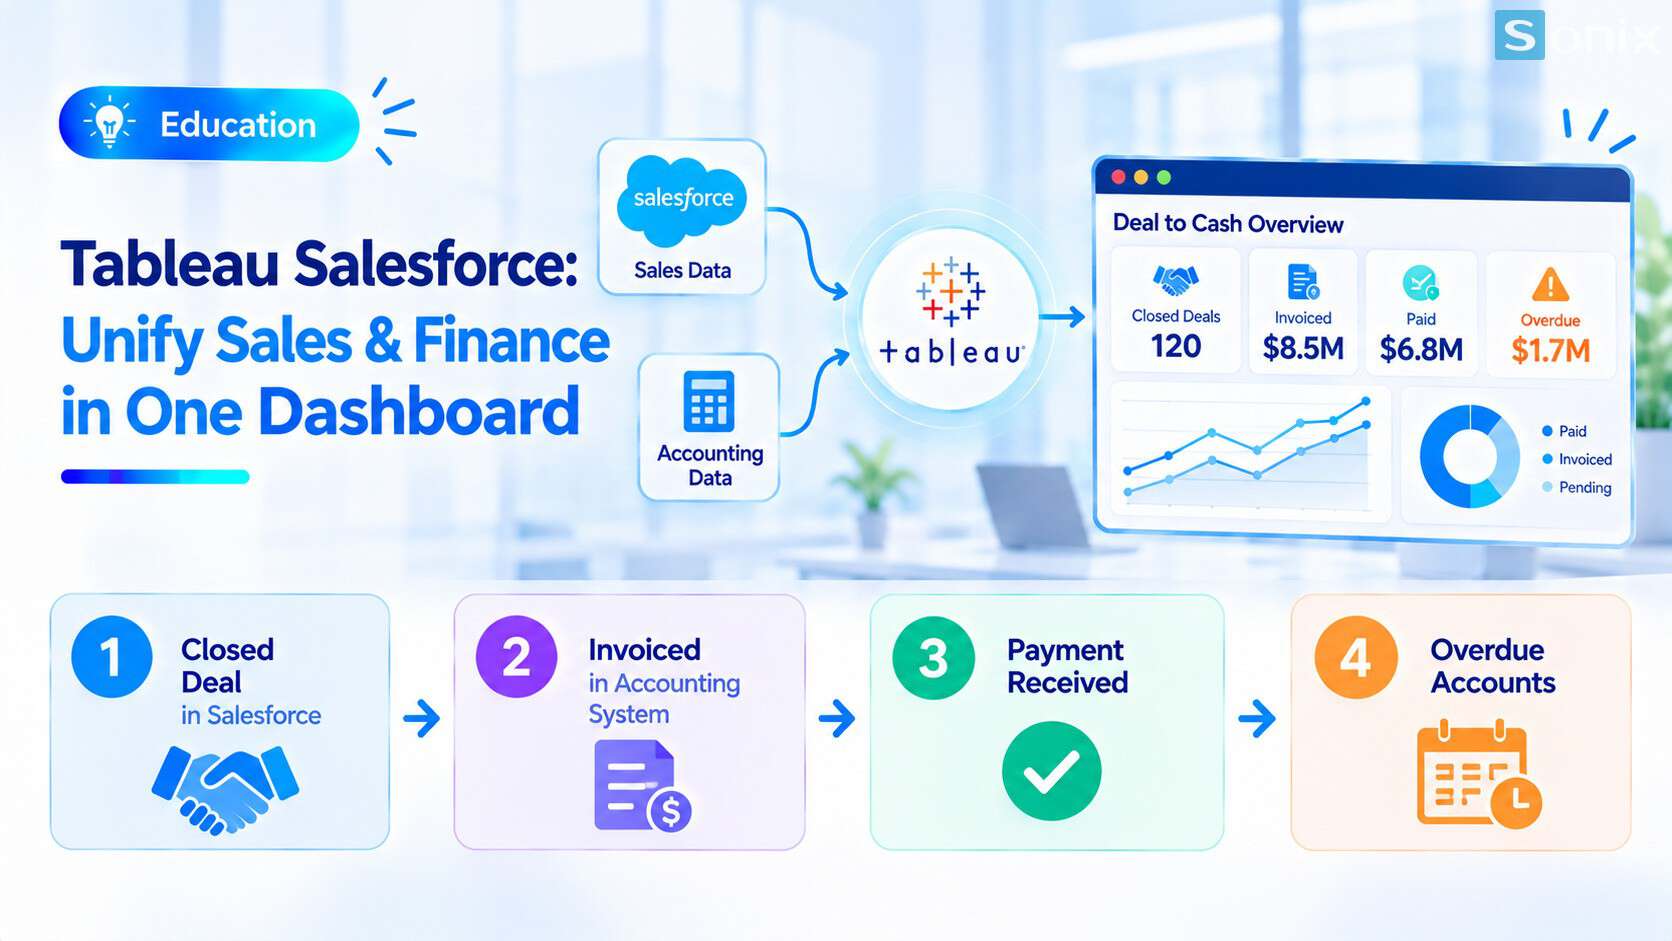
One dashboard shows deals closed, invoiced, collected and overdue.
Why sales and accounting are both right but the numbers differ
Sales and accounting often use the same word for two different events. To sales, revenue is the moment a deal closes in Salesforce. To accounting, money counts only once the invoice is issued and the payment has arrived. The two moments can be weeks apart.
| How sales see it | How accounting sees it | |
|---|---|---|
| Point of recognition | Deal closed-won in Salesforce | Invoice issued, cash received |
| Data source | Salesforce | Accounting software |
| Typical question | How much did we hit against target this month? | Which customer still owes, and how overdue? |
| Hypothetical example | Hit 120% of target | Cash received only 70% |
Both are right by their own definitions. The problem is that nobody sees the gap between them: deals closed but not yet invoiced, invoiced but not yet collected, or collected but overdue. That gap is exactly what one shared view can reveal.
One Tableau Salesforce view from deal to cash
A combined dashboard usually tracks four consecutive states of a deal. Each state comes from a different data source.
| State | Meaning | Data source |
|---|---|---|
| Closed | A deal is won, with a value and a customer | Salesforce |
| Invoiced | An invoice was issued for that deal | Accounting software |
| Collected | The payment has arrived | Accounting software |
| Overdue | The invoice is past due and unpaid | Accounting software |
If you are unsure how this tool differs from the built-in reports in Salesforce, read What Is Tableau and how it differs from Reports & Dashboards.
How Tableau Salesforce combines the two sources
The process has four steps. Names in the interface may differ slightly by release.
Connect Salesforce for the deal data
- According to the Tableau documentation for the Salesforce CRM connector, this connection uses extracts, meaning data is copied and refreshed on a schedule rather than queried live all the time
- So the dashboard is only as fresh as the last refresh. State the update time on the dashboard
Connect the accounting data source
- Depending on the system, data can come from exported files (Excel, CSV) or from a database
- Which works depends on how your accounting software lets you export or access data, and needs investigation first
Link the two sources with a shared key
- According to Tableau’s Plan the Data Source documentation, relationships are the default way to combine data, and they can join tables from different connections
- There is also data blending, which suits cases where the linking field varies from sheet to sheet. See the Blend Your Data guide
Build the dashboard and set permissions
- Create the measures: value closed, invoiced, collected and overdue, by customer and by month
- Receivables and financial data are sensitive, so limit who can view them
The requirement: a shared key between the two systems
This is the key requirement. According to Tableau’s documentation on data blending, to know how to combine data, the two sources must share at least one field, called the linking field. The documentation also notes that if values are written differently, for example Lt. Blue in one place and Light Blue in another, Tableau will not recognize them as the same and you must handle it by re-aliasing.
With sales and accounting data, the same thing happens all the time. Customer names make a poor linking field because each system writes them its own way.
| Linking field | Reliability | Comment |
|---|---|---|
| A shared customer code | High | Ideal if both systems use the same code |
| Contract number or order number | High | Ties each deal to each invoice |
| Tax code | Fair | Useful for business customers, check that data is complete |
| Customer name | Low | ABC Co., Ltd and Công ty ABC are two different strings |
Hypothetical example: an office equipment distributor records a customer as KH0215 in Salesforce, but the accounting software uses a different code. Before building the dashboard, they create a mapping table between the two systems and assign someone to keep it current. This takes more effort than building charts, but it is the part that decides accuracy.
Getting data from accounting software
Accounting data usually reaches Tableau in one of three ways. Each has its own pros and cons.
| How data is pulled | Pros | Cons |
|---|---|---|
| Excel or CSV exported on a schedule | Simple, most software can do it | Depends on someone exporting, data may lag |
| Read directly from a database | Automatic, little manual work | Depends on whether the software allows access |
| Through an API or an integration layer | Flexible, you control the data flow | Needs the technical team and setup effort |
For accounting packages common in Vietnam, such as MISA or FAST, what is feasible depends on the version and how the system allows data export or access, so it needs specific investigation before you commit. This is a point the article cannot settle for you.
When many systems need to exchange data, consider an integration layer. To follow key metrics every morning, read Tableau Pulse: 3 key metrics each morning.
Notes for rollout
Sensitive data. Receivables and revenue are financial data. Think carefully about who sees what before sharing a dashboard.
Definitions confirmed by accounting. How revenue and overdue receivables are calculated must match your chief accountant’s rules and practice. This article does not replace professional judgment.
Cost and license. Tableau is priced by user role and may need implementation effort. Ask for a quote based on your real needs. This is general reference, not financial advice.
Clean data decides the quality of every report, so see Einstein AI in Salesforce for sales and marketing. If you need help, see Sonix’s Salesforce solutions (in Vietnamese).
Checklist before combining sales and accounting numbers
Before talking to an implementation partner, run through this short list.
☐ Agreed what sales and accounting each mean by closed, invoiced and collected
☐ Identified a shared key between Salesforce and the accounting software
☐ Built a customer code mapping table and assigned an owner to keep it current
☐ Investigated how the accounting software exports or exposes data
☐ Accepted that data updates on a schedule, not instantly, and stated this on the dashboard
☐ Decided who may view receivables and financial data
☐ Asked the chief accountant to confirm the metric definitions
Do your sales and accounting teams share the same customer code? Leave a comment below and the Sonix team will suggest how to start.
Tableau
ERP System
Data Analytics
Business Intelligence
Business
Book a consultation with Sonix to review your data sources and decide how to combine deal data with accounting, before you invest.
Sonix: Your success is our happiness.
Leave us your comment