

 Tiếng Việt
 日本語
Tableau Pulse is a feature that sends key metrics to the people who need them, with a plain-language explanation of why a metric went up or down. Dashboards look great but nobody opens them, so bad numbers surface only when it is too late. Perhaps the numbers should find the people who need them, instead of waiting to be opened.
The short answer: you follow metrics such as revenue, lead count or win rate, then receive a regular summary by email or Slack with an AI-written explanation. The best way to use it is to pick few metrics, give each one an owner, and agree on definitions first. Features and licensing depend on the Tableau plan you use, so check before you commit.
Important note: the office equipment distributor and the metrics below are hypothetical examples, not real customers. Tableau features change quickly, depend on plan and license, and menu names may differ by release. According to the official documentation, Tableau Pulse is currently used on Tableau Cloud. Check the latest documentation before you decide.
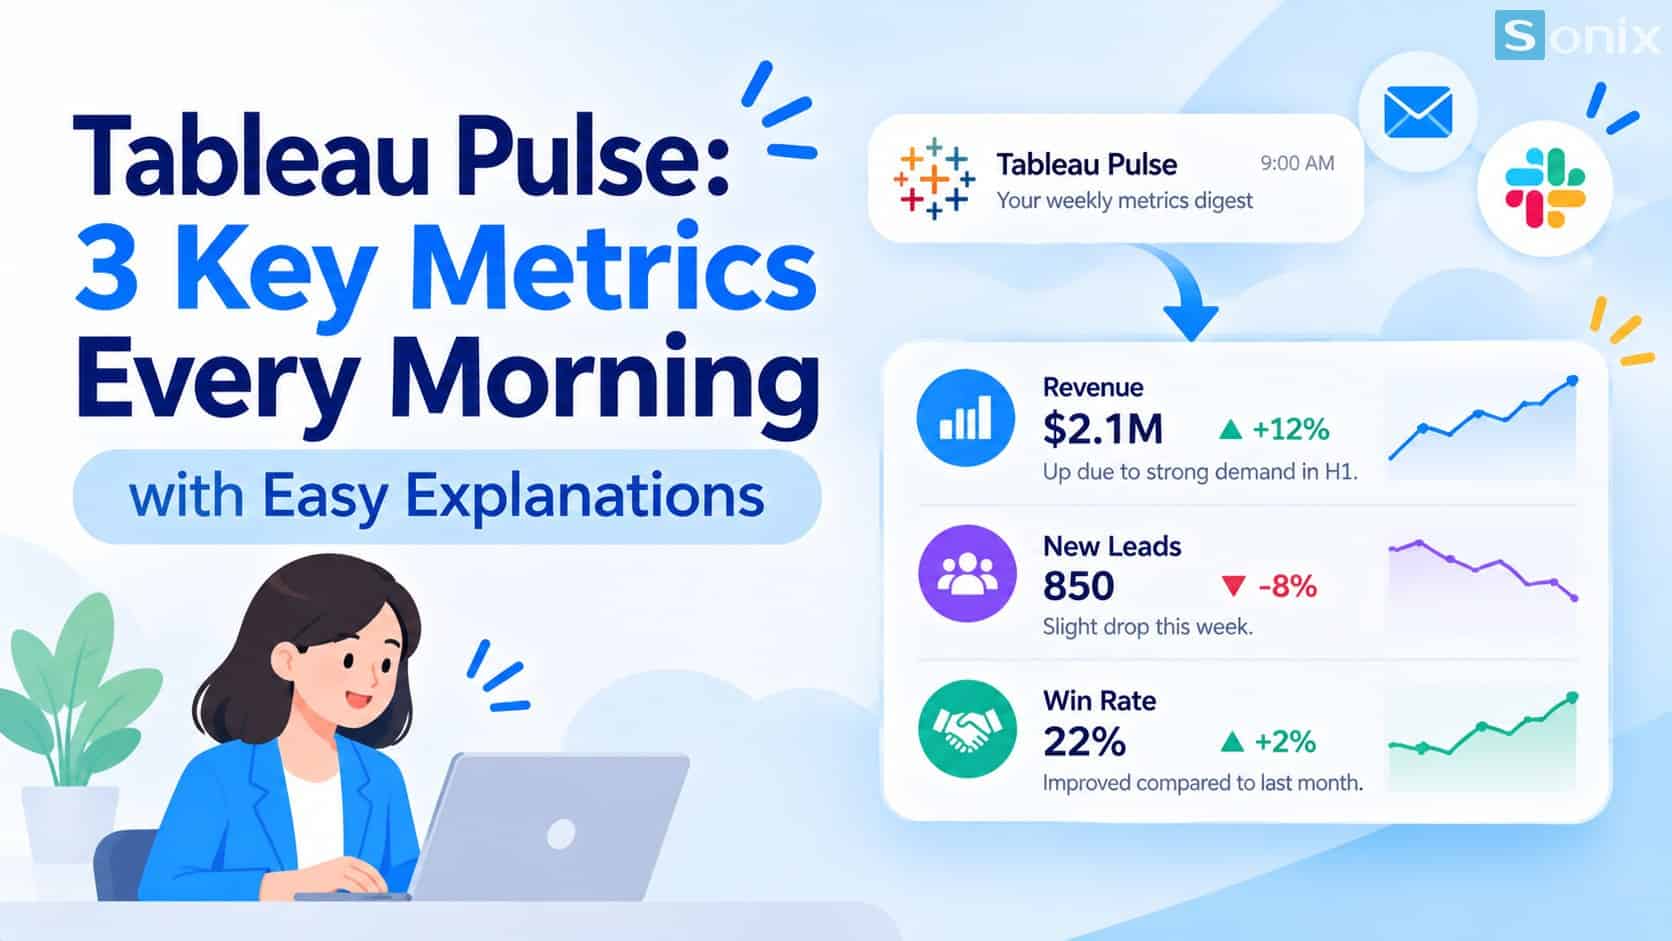
Metrics reach the people who need them by email or Slack, with a short explanation attached.
Why dashboards look great but nobody opens them
A dashboard only helps when someone opens it. In practice, many managers are stuck in meetings or firefighting, and the dashboard becomes something they look at only when a report is due. Bad numbers are therefore found late, when someone happens to see them or when a customer has already complained.
According to the official Tableau documentation, Tableau Pulse lets people who do not regularly use Tableau understand their data without leaving the places where they normally work. The table below shows how it differs from viewing a regular dashboard.
| Regular dashboard | Tableau Pulse | |
|---|---|---|
| How it reaches viewers | Viewers must open it themselves | Sent to email or Slack |
| When something changes | Viewers must notice it themselves | Alerts when a new unfavorable trend appears |
| Explaining the numbers | Guess, or ask an analyst | Plain-language explanation written by AI |
| Best-fit users | People already comfortable with analytics tools | Also people who rarely open Tableau |
What is Tableau Pulse and how does it work
Tableau Pulse revolves around metrics. When you follow a metric, notable changes are sent to you in a digest. According to the guide to exploring metrics in Tableau Pulse, you choose to receive digests by email, Slack or both, daily, weekly or monthly, with weekly as the default.
Define the metric
- A user with the Creator role defines the metric from a data source already published on Tableau Cloud
- Hypothetical examples: monthly revenue, new leads, win rate
Follow the metric
- Each person chooses to Follow the metrics they care about
- When you follow two or more metrics, you also get a combined summary of notable changes
Receive digests and alerts
- The summary arrives by email or Slack with an explanation of what is influencing the metric
- If a new unfavorable trend is detected, you receive an alert in your digest
Explore further when needed
- From the digest, open the metric page to see related charts and suggested questions
- People who rarely use Tableau can still explore with guidance
For a full overview, see Tableau’s About Tableau Pulse page. If you are unsure how Tableau differs from built-in Salesforce reports, read What Is Tableau and how it differs from Reports & Dashboards.
How managers can use Tableau Pulse well
A tool only helps when used well. The three principles below are worth agreeing on before you switch it on for the whole team.
Pick few metrics. If you could follow only 3 metrics every morning, which would they be? The more metrics, the longer the digest and the fewer people read it. Start with metrics that truly change your decisions.
One owner per metric. When a number turns bad, it must be clear who asks why and who acts.
Agree on definitions first. If everyone says win rate but one person counts deals and another counts value, the AI explanation will only expose that gap. Settle the formula and data source before turning it on.
Here is a hypothetical example for an office equipment distributor.
| Metric | Owner | Definition to agree on |
|---|---|---|
| Monthly revenue | Sales director | Counted by order close date or invoice date |
| New leads | Marketing lead | Which leads count as valid, and how duplicates are removed |
| Win rate | Sales manager | By number of deals or by value, over what period |
Data quality decides the quality of the explanation. Read more in Einstein AI in Salesforce for sales and marketing. If your team uses Slack, Slack Salesforce: 4 easy ways to get deal updates shares ways to avoid notification overload.
What to check before turning it on
Plan and platform. According to the official documentation, Tableau Pulse runs on Tableau Cloud, and an administrator must turn the feature on for the site. Some features are also tied to the subscription plan. Ask your provider before planning.
AI is a separate switch. The AI summary has its own setting, and turning on Tableau Pulse does not turn it on. An administrator needs to enable Tableau AI if users should see personalized summaries.
Published data sources. You need data sources already published on the site to create metrics.
Slack needs integration. To receive digests in Slack, an administrator must first integrate Tableau with the Slack workspace.
No per-metric permissions. According to the documentation, metrics in Tableau Pulse are not part of the project-based permission hierarchy, so you cannot deny a user access to an individual metric. Think ahead about sensitive metrics such as salaries or profit.
Display language. The documentation says Tableau Pulse supports 14 languages. Confirm that the language you need is supported, and to what extent, before rollout.
If you would like to talk through a data analytics roadmap for your business, see Sonix’s Salesforce solutions (in Vietnamese).
Tableau Pulse rollout checklist
Before switching it on for the whole team, run through this short list.
☐ Picked 3–5 metrics that truly affect decisions
☐ Named one owner for each metric
☐ Agreed on the definition and data source of each metric
☐ Checked that your Tableau plan, platform and license support it
☐ Turned on Tableau AI and set up the Slack integration if needed
☐ Thought through sensitive metrics, since you cannot block individual metrics
☐ Confirmed the display language and a suitable digest frequency
If you could follow only 3 metrics every morning, which would you pick? Leave them in the comments and the Sonix team will suggest how to set it up.
Tableau
Einstein AI
Data Analytics
Business Intelligence
Book a consultation with Sonix to choose the metrics worth following and check whether your Tableau plan is ready, before you roll out.
Sonix: Your success is our happiness.
Leave us your comment